| |
|
January 29, 2009
Salesrep Budgets
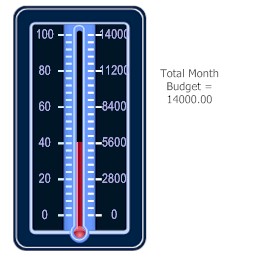
How close a salesrep is to their
budget is display under the Financial Manager section, Forecast and
Funnel, Sales Budgets. A sample graph is to the right. The
gauge shows the budget and how close they are to meeting their
budget. For example, the sales budget for the month 14000 and this
has already sold 40 percent of their budget.
Budgets can be set for each rep and
also for each category of inventory.
View the tutorial for setting up budgets
|
|
| |
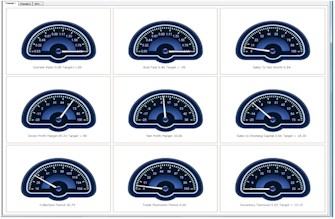
Financial Ratios
The common financial ratios are now
easily calculated and displayed in the Financial Manager
section.
Select Snapshots and Ratio
Analysis. View the tutorial on financial ratios for more
information.
You must first setup the general
ledger number ranges for calculating the ratios.
|
|
| |
Sales Opportunities, Sales Forecast, Lead Tracking,
Sales Funnel
Complete tracking of the sales
process from opportunity to close is now available in the sales
prospecting section. This includes lead history, closing rates,
profitability of each type of lead.
The step of the sales process for
each opportunity is displayed and graphed.
The opportunity information is used
to create the sales funnel chart.
View the tutorial from your program.
|

|
Accounts
Payable
Search for a voucher by the payable
amount.
Service
Filter added to the display car stock
and restock screens. You can now filter for the specific item
instead of scrolling for it.
Sales
Prospecting
Display prospect now has a tab for
forecast. Enter opportunities and move them along your sales
pipeline.
Opportunity menu added to the sales
prospecting section to entering opportunities, managing opportunities, and
analyzing them.
Financial
Manager
New analysis reports and graphs have
been added to the financial manager section.
Top/Bottom Customers.
Now has an option to calculate on profit as well as
sales.
Obsolete Inventory.
Determine items which have not sold. These can then be
moved to a new obsolete category. General ledger entries are made
to "write off" the inventory to your financial
statements.
Top/Bottom Inventory.
Find your top or bottom inventory in terms of sales, count, or
profitability. This can be done for number (best selling in terms
of quantity), sales amount, or profitability.
Ratio Analysis.
Common financial ratios are calculated and displayed on a
dashboard. Historical values for these ratios can also be
displayed for the previous 24 months to help identify trends.
There is some setup involved in this process.
Forecast Sales.
Display a forecast of the pending sales for the next 3
months. This is done by count and estimated
revenue.
Lead Analysis.
Analyze your lead sources for profitability, conversion rate,
and count. Determine if a lead source (such as yellow pages, golf
tournaments, etc) is profitable.
Sales Budgets.
Dashboard of sales budgets and where how close the rep is to
making their budget. Budgets can be set for total sales and/or by
category for each rep.
Returning customers.
This report gives you customers who made a purchase in a given
date range where the last purchase was in a different date
range.
Sales graph snapshot.
Gives a graph and details of total sales, by rep, by category,
and by rep/category for each of the previous 24
months.
Cost graph snapshot.
Gives a graph and details of total costs, by rep, by category,
and by rep/category each month for the previous 24
months.
Profit graph
snapshot. Same as above but for profit.
Inventory
Analysis. Shows inventory usage for a date range by
category detailing price, cost, and profit.
Service
Manager
New analysis and graphs have been
added to the service manager section.
Tech call analysis.
Shows calls, partial completes, call backs, average repair,
average travel, average miles per day for techs in a given date
range. This can be graphed as well. Double click on the
column heading to graph that one column.
Machines with no
service. All machines that have not had a service call
since a given date.
Excessive Calls.
Machines that have had more than the give service calls in the
given date range. For example, all machines that have had 4 calls
in the last 35 days.
Create Survey List.
Send an email survey to customers that have had a service call
in the date range. The email survey is created as an email
template in the sales prospecting
section.
Previous Newsletters
Click on a link to view previous newsletters
Subscription Request
| |